Fluke
Fluke are the acknowledged world leader in handheld test instruments covering every area of electronic, electrical and environmental test.
Their bench instrument range similarly includes many class leading products.
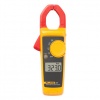 |
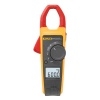
320 Series 320 Series Clamp meter |
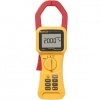 |
350 Series 350 Series Clamp meter |
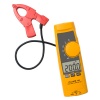 |
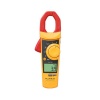
365 Detachable TRMS Clamp Meter |
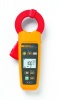 |
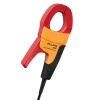
368 FC and 369 FC Leakage current clamp meters with 40 or 61mm jaws |
 |
370 Series 370 Series Clamp Meter |
|
|
377 and 378 FC/E 1000A AC/DC TRMS Non-contact clamp meter range with PQ and FC options |
 |
381 Remote display TRMS clamp meter |
 |
902/E True RMS HVAC Clamp Meter |

 |
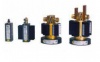
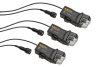
Current clamps AC and DC Current clamps for Fluke equipment |

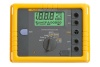 |
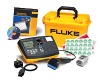
1623-2/1625-2 Geo Earth Ground Tester - basic or advanced models and kits |

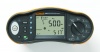 |
1660 Series Installation Tester |

 |
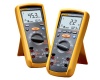
1500 Series Insulation Resistance Tester - 2 and 10 GΩ models |
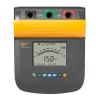 |
1550/1555 Insulation Resistance Tester - 5 and 10kV models |
 |
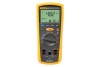
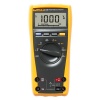
1577/1587 Insulation Multimeter |

 |
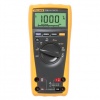
110 Series Compact digital multimeters |
|
|
1577/1587 Insulation Multimeter |
 |
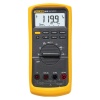
170 Series Flexible and accurate digital multimeters |
 |
20 Series Rugged IP67 Industrial Multimeters |
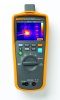 |
279 FC Wireless TRMS Thermal Multimeter |
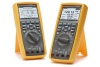 |
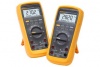
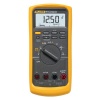
280 Series True RMS electronics logging digital multimeters |
 |
70 Series General purpose industrial digital multimeters |
 |
80 Series Industrial electrician's digital multimeters |
|
|
85x8A Precision multimeter |
 |
88 Series V Automotive Meter Combo Kit |
 |
Connect 3000 Series Fluke Connect (FC) Wireless system of meters, modules and probes. |

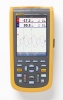 |
120B Series Dual input ScopeMeter 20 or 40MHz models |
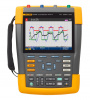 |
190 Series III ScopeMeter series, 2 or 4 channels, 60 to 500MHz |
 |
MDA-550 Series III Motor Drive Analyzer |

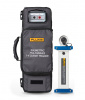 |
PVA-1500 Solmetric PV analyzer series |

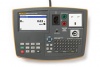 |
6200/6500 UK Portable Appliance Tester |

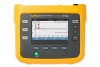 |
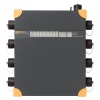
1736 3 Phase Power Logger |
 |
1760 3 Phase Power Quality Recorder Topas |
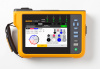 |
1770 Series 3 Phase Power Quality Analyzer range with waveform capture options |
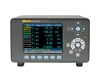 |
Norma 4000 Power Analyzer 1, 2 or 3 phase models |
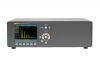 |
Norma 5000 Power Analyzer 3, 4 or 6 phase models with a variety of options |
 |
VR1710 Single Phase Power Quality Recorder |

 |
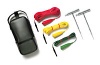
Accessories Accessories for Fluke equipment |
 |
Connect Accessories Fluke Connect accessories |
 |
Installation Tester Accessories Accessories for Fluke Installation Testers |
 |
Norma 4000/5000 Accessories Accessories for the Norma 4000 and 5000 Power Analyzers |
 |
PAT Accessories Accessories for Fluke Portable Appliance Testers |
 |
Power Quality Tools Accessories |
 |
ScopeMeter accessories Accessories for Fluke ScopeMeters |
 |
Thermal Imager Accessories Accessories for Fluke Thermal Imagers |

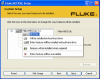 |
Software Fluke software |

|
|
279 FC Wireless TRMS Thermal Multimeter |
 |
PTI120 Pocket Thermal Imager |
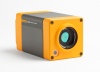 |
RSE Series Mounted Infrared Camera with interchangeable lenses and resolution options |
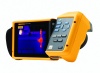 |
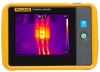
Ti Expert Series Thermal Imager - Expert series autofocus with high resolution 5.7" touch screen |
 |
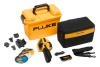
Ti Professional Series Thermal Imager - Professional series, autofocus with interchangeable lenses |
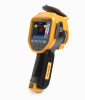 |
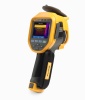
Ti300+ Thermal Imager with interchangeable lenses and autofocus |
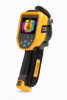 |
TiS Performance Series Thermal imaging scanner with 3.5" touchscreen |

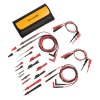 |
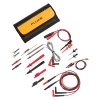
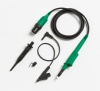
Test Leads, Probes and Clips Probes, clips, test leads and accessories for Fluke equipment |